
Washington, DC—On average, consumers say they will spend $1,007.24 during the holiday season this year, according to a survey by the National Retail Federation (NRF) and Prosper Insights & Analytics. That represents a 4.1% increase from the $967.13 they said they would spend last year, according to NRF.
“The holidays are just around the corner, and consumers are ready to shop,” said Matthew Shay, NRF president and CEO. “Confidence is near an all-time high; unemployment is the lowest we’ve seen in decades, and take-home wages are up. All of that is reflected in consumers’ buying plans. Retailers expect strong demand this year. Moreover, they are prepared with a wide array of merchandise. And they are offering strong deals and promotions during the busiest and most competitive shopping season of the year period.”
While tariffs on a wide range of consumer goods from China recently took effect, Shay noted that retailers imported record volumes of merchandise ahead of the tariffs this summer. He added that any effect on pricing during the holiday season is expected to be minimal.
The new consumer survey comes on top of NRF’s annual holiday spending forecast. It takes into account various economic factors to project overall spending rather than per-consumer spending.
The forecast estimated that holiday retail sales in November and December will be up between 4.3% and 4.8% over 2017 for a total between $717.45 billion and $720.89 billion.
In addition, the annual survey found that consumers will spend in three main categories during the holidays: gifts, at $637.67; non-gift holiday items, such as food, decorations, flowers and greeting cards, at $215.04; and other non-gift purchases that take advantage of the deals and promotions throughout the season, at $154.53.
Consumers’ Holiday Spending Plans: NRF
Planned holiday spending per consumer (2004 – 2018)

Data for 2004 – 2016 reflects Prosper’s revised estimate
Moreover, according to the NRF, holiday shoppers are planning to spread their shopping across multiple channels and types of stores. An equal number (55%) will shop online and in department stores while 51% will go to discount stores, 44% to grocery stores, 33% to clothing stores and 24% percent to electronics stores.
The mix of channels was further evident with 50% percent of those shopping online saying they will pick up their purchases in-store. Of online shoppers who want the package to come to their home or office, 94% will take advantage of free shipping, 16% will choose expedited shipping, and 11% will use same-day delivery.
According to the survey, many holiday shoppers (60%) are waiting until at least November to begin browsing and buying items for the season. However, 21% planned to start in October and 18% said they began in September or earlier. Of the early shoppers, 61% were trying to spread out their budgets while 47% just wanted to avoid the crowds and stress of last minute shopping.
The NRF also found that while sales and discounts remain the largest factor in choosing a particular retailer, cited by 71%, quality and selection of merchandise were the next-largest factor (60%), followed by free shipping (47%) and convenient location (45%).
“Consumers will be scouring through retailers’ ads to make sure they are getting the best deal possible,” said Phil Rist, Prosper Insights’ executive vice president of Strategy. “Although sales will remain an important factor, shoppers want good quality and want to be able to find what they’re looking for.”
Gifts Consumers Would Like to Receive: NRF
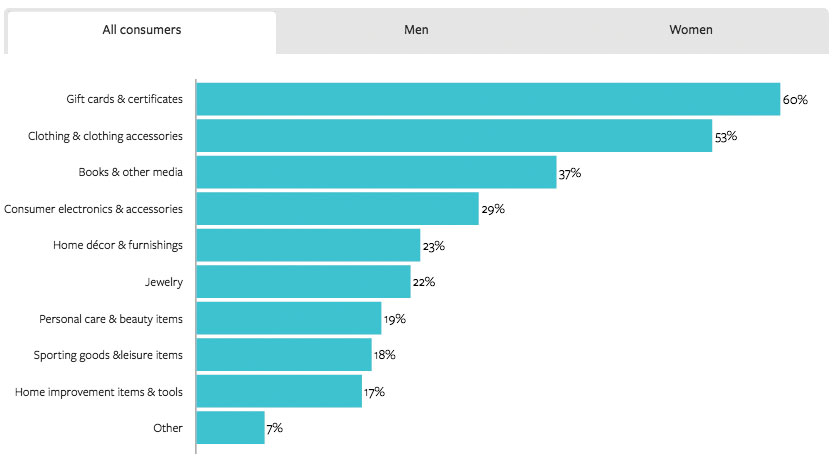
For the 12th year in a row, gift cards remain the most popular items on wish lists of those surveyed. Gift cards are followed by: clothing and accessories (53%); books/movies/music (37%); electronics (29%); home décor (23%); jewelry (22%); personal care items (19%); sporting goods (18%); and home improvement items (17%).
The survey of 7,313 adult consumers was conducted October 1–11, 2018. Moreover, it has a margin of error of plus or minus 1.2 percentage points.


